Download
TV3DProfiler.rar [49kb] – Visual Basic.NET 2005
Description
You like the profiler in TV3D 6.5, but you’d like to do the same with your own application code? Hate the fact that what it reports is not tweakable or modifyable in any way? Here’s my own implementation of a profiler, which imitates the built-in one but has definable profiles and now categories, and is braindead-simple to use.
Features
- Flag your own code sections, name them, and see directly how much time they take to process
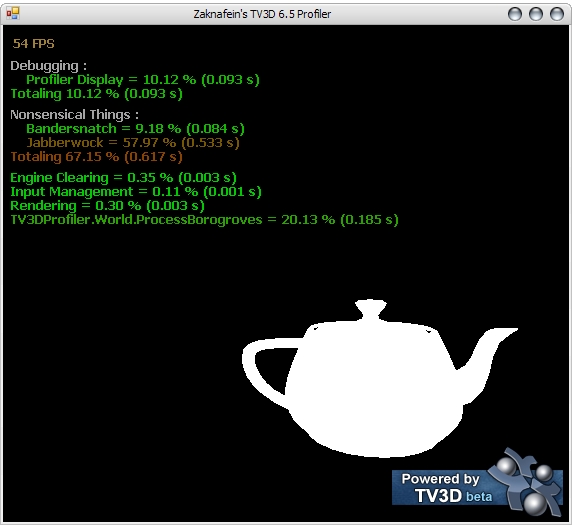
- Categorize the profiles (or code sections) and the statistics will reflect those
- Naming is too much of an effort? Just don’t provide any name, and the profiler uses stack frame reflection to find the name of the type and method which called it!
- Supports the “Using” keyword (with IDisposable profile hooks)
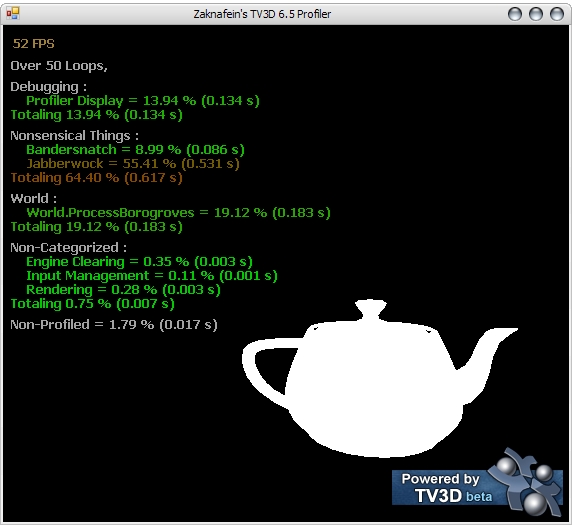
- Color-coded display which highlights the slow profiles
- The elapsed times are accumulated on a defined number of loop, or a total amount of time
- A profile for the profiler display is auto-added, so it doesn’t affect the results
- Verbosity setting allows to show the unprofiled time and loop count
- Shows the percentage of time usage for every flagged profile as well as its actual accumulated time
- Uses the PerformanceCounter APIs for maximal accuracy and speed
- Contains obscure references to the Lewis Carroll poem Jabberwocky! D:
Also, this sample is the first to use the structure which all my future demos (and eventually, all my past demos as well) will be based on. Read more on this page.